
Portal:Slovenia
The Slovenia Portal
 |

|
 | |
Slovenia (/sloʊˈviːniə, slə-/ ⓘ sloh-VEE-nee-ə; Slovene: Slovenija [slɔˈʋèːnija]) officially the Republic of Slovenia (Slovene: (Full article...)
Selected article -
_(5468849812).jpg)
Maribor (UK: /ˈmærɪbɔːr/ MARR-ib-or, US: /ˈmɑːr-/ MAR-, Slovene: [ˈmáːɾibɔɾ] ⓘ; also known by other historical names) is the second-largest city in Slovenia and the largest city of the traditional region of Lower Styria. It is also the seat of the City Municipality of Maribor, the seat of the Drava statistical region and the Eastern Slovenia region. Maribor is also the economic, administrative, educational, and cultural centre of eastern Slovenia.
Maribor was first mentioned as a castle in 1164, as a settlement in 1209, and as a city in 1254. Like most Slovene ethnic territory, Maribor was under Habsburg rule until 1918, when Rudolf Maister and his men secured the city for the State of Slovenes, Croats and Serbs, which then joined the Kingdom of Serbia to form the Kingdom of Yugoslavia. In 1991 Maribor became part of independent Slovenia. (Full article...)Did you know (auto-generated)

- ... that Franček Gorazd Tiršek, a para-shooter from Slovenia, won three silver medals at the Summer Paralympic Games, the most recent one in Tokyo?
- ... that Slovenian-born singer Ben Dolic was set to represent Germany at Eurovision in 2020?
- ... that the union of taxi drivers offered the residents of retirement homes free transport to the voting stations in the Slovenian Waters Act referendum?
- ... that after Domen Križaj from Slovenia was a prize winner in the singing competition Neue Stimmen, he moved to the Oper Frankfurt where he appeared as Massenet's Albert and Mozart's Papageno?
- ... that in Toplak and Mrak v. Slovenia—initiated by two disabled voters over polling place access in a gay marriage referendum—the European Court of Human Rights extended its jurisdiction to referendums?
- ... that Franc Pinter, a para-shooter from Slovenia, competes at his eighth Summer Paralympic Games in Tokyo?
Topics
More did you know
- ... that A Summer in a Sea Shell was the first Slovenian coming-of-age film to have popular music and dancing?
- ... that Austrian ice hockey administrator Hans Dobida was inducted into the German and Slovenian hockey halls of fame?
Related portals
Religions in Slovenia
Ex-Yugoslav countries
Other countries
WikiProjects

General images
-
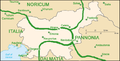 Map of Slovenia with ancient Roman provinces and cities (as of 100 A.D.) in green and present-day frontiers in grey. (from History of Slovenia)
 -
 The Solkan Bridge, built in 1906 (from History of Slovenia)
 -
 The Ottoman army battling the Habsburgs in present-day Slovenia during the Great Turkish War. (from History of Slovenia)
 -
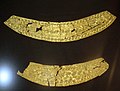 Gold appliqués, Urnfield culture, c. 1200 BC. (from History of Slovenia)
 -
-
 Slavic settlement in 631 under the Slavic King Samo. (from History of Slovenia)
 -
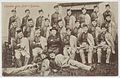 Members of the Catholic Orel association in Lower Carniola before World War One (from History of Slovenia)
 -
 Vače Situla, Hallstatt culture, 5th century BC (from History of Slovenia)
 -
 Princely warrior equipment, Hallstatt culture (from History of Slovenia)
 -
 The Freising Manuscripts, dating from the 10th century A.D., most probably written in upper Carinthia, are the oldest surviving documents in Slovene. (from History of Slovenia)
 -
 Piran, a coast town (from Tourism in Slovenia)
 -
 Lake Bled (from Tourism in Slovenia)
 -
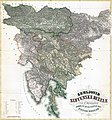 Peter Kozler's map of the Slovene Lands, designed during the Spring of Nations in 1848, became the symbol of the quest for a United Slovenia. (from History of Slovenia)
 -
 Praetorian Palace in the 19th century (from Culture of Slovenia)
 -
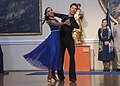 Slovenian dancers at the National Gallery in 2019 (from Culture of Slovenia)
 -
 The Sower (1907), by the Impressionist painter and musician Ivan Grohar, became a metaphor for the Slovenes and was a reflection of the transition from a rural to an urban culture. (from Culture of Slovenia)
 -
 Milan Kučan (from History of Slovenia)
 -
 The installation of the Dukes in Carinthia, carried out in an ancient ritual in Slovene until 1414. (from History of Slovenia)
 -
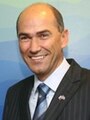 Janez Janša (from History of Slovenia)
 -
 The proclamation of the State of Slovenes, Croats and Serbs at Congress Square in Ljubljana on 20 October 1918 (from History of Slovenia)
 -
 Coat of arms of the Socialist Republic of Slovenia (from History of Slovenia)
 -
 The annexed western quarter of Slovene ethnic territory, and approximately 327,000 out of the total population of 1.3 million Slovenes, were subjected to forced Fascist Italianization. On the map of present-day Slovenia with its traditional regions' boundaries. (from History of Slovenia)
 -
 Bronze breastplate, Hallstatt culture, 600 BC (from History of Slovenia)
 -

-
 Janez Drnovšek, Prime Minister of Slovenia between 1992 and 2002, and president of Slovenia between 2002 and 2007 (from History of Slovenia)
 -
 The execution of Matija Gubec, leader of the Croatian–Slovene Peasant Revolt, in 1573. (from History of Slovenia)
 -
 Folk musician Lojze Slak (from Culture of Slovenia)
 -
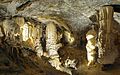 Postojna Cave (from Tourism in Slovenia)
 -
 Ljubljana Marshes Wheel, c. 3150 BC (from History of Slovenia)
 -
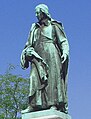 The sculpture of the poet Valentin Vodnik (1758–1819) was created by Alojz Gangl in 1889 as part of Vodnik Monument, the first Slovene national monument. (from Culture of Slovenia)
 -
 Part of a late 19th century cannon (from History of Slovenia)
 -
 Planica (from Tourism in Slovenia)
 -
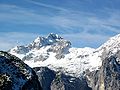 Triglav, the highest peak (from Tourism in Slovenia)
 -
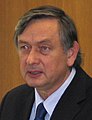 Danilo Türk (from History of Slovenia)
 -
 A Romantic veduta of Mount Triglav by the Carinthian Slovene painter Markus Pernhart. In the Romantic era, Triglav became one of the symbols of Slovene identity. (from History of Slovenia)


.jpg)


.jpg)
.jpg)
.jpg)


.jpg)


.jpg)


.jpg)
,_dve_prvi_premi,_zadnja_za_regiranje._V_krclu_zasajeni_%22piki%22_1960_(3).jpg)


Selected picture
-
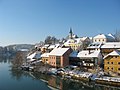 The old part of Novo mesto with the Krka river
 -
 Panorama of Lake Palčje in southwestern Slovenia during high waters in early winter
 -

-
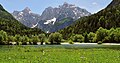
 North side of Jalovec mountain in the Julian Alps, Slovenia
 -

-
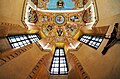 Altar ceiling of St. George's Chapel, Ljubljana Castle
 -
-
 Pietro Stanislao Parisi with family, by Giuseppe Tominz, 1849
 -
 View from Šmarjetna Gora towards Škofja Loka
 -
 Sora river in Škofja Loka


.jpg)
Slovenia lists

Cities and towns
| Rank | Name | Population | Traditional region | ||
|---|---|---|---|---|---|
| 2023 pop. | 2011 pop. | Percentage change | |||
1.
|
.svg) |
287.076
|
272.220
|
Upper and Lower Carniola | |
2.
|
.svg) |
96.209
|
95.171
|
Styria | |
3.
|
 |
37.944
|
36.874
|
Upper Carniola | |
4.
|
 |
37.188
|
37.520
|
Styria | |
5.
|
 |
26.100
|
24.996
|
Slovene Littoral | |
6.
|
 |
25.235
|
25.456
|
Styria | |
7.
|
 |
24.234
|
23.341
|
Lower Carniola | |
8.
|
 |
17.984
|
18.164
|
Styria | |
9.
|
 |
13.800
|
13.644
|
Upper Carniola | |
10.
|
 |
13.702
|
13.440
|
Upper Carniola | |
11.
|
 |
13.678
|
15.163
|
Styria | |
12.
|
 |
13.222
|
12.406
|
Upper Carniola | |
13.
|
 |
13.021
|
13.178
|
Slovene Littoral | |
14.
|
 |
11.797
|
11.969
|
Upper Carniola | |
15.
|
 |
11.566
|
11.223
|
Slovene Littoral | |
16.
|
 |
11.190
|
11.614
|
Prekmurje | |
17.
|
 |
10.211
|
8.942
|
Inner Carniola | |
18.
|
 |
9.987
|
9.183
|
Inner Carniola | |
19.
|
 |
8.969
|
8.413
|
Inner Carniola | |
20.
|
 |
8.301
|
7.454
|
Styria | |
21.
|
 |
8.126
|
8.672
|
Lower Carniola | |
22.
|
 |
7.702
|
7.098
|
Lower Carniola | |
23.
|
 |
7.513
|
7.519
|
Styria | |
24.
|
 |
7.207
|
6.112
|
Upper Carniola | |
25.
|
 |
7.160
|
6.979
|
Carinthia | |
26.
|
 |
7.037
|
6.656
|
Slovene Littoral | |
27.
|
 |
7.003
|
6.573
|
Styria | |
28.
|
 |
6.852
|
7.097
|
Lower Carniola | |
29.
|
 |
6.688
|
6.467
|
Upper Carniola | |
30.
|
 |
6.151
|
5.531
|
Slovene Littoral | |
31.
|
 |
6.099
|
5.940
|
Upper Carniola | |
32.
|
 |
6.022
|
6.439
|
Upper Carniola | |
33.
|
 |
5.848
|
5.955
|
Slovene Littoral | |
34.
|
.svg) |
5.426
|
5.776
|
Lower Carniola | |
35.
|
 |
5.390
|
5.178
|
Upper Carniola | |
36.
|
 |
5.240
|
5.181
|
Upper Carniola | |
37.
|
 |
5.220
|
5.111
|
Styria | |
38.
|
 |
5.152
|
4.869
|
Styria | |
39.
|
5.017
|
4.762
|
Styria | ||
40.
|
5.004
|
4.943
|
Styria | ||
41.
|
4.829
|
5.621
|
Styria | ||
42.
|
4.646
|
4.643
|
Carinthia | ||
43.
|
4.574
|
4.660
|
Styria | ||
44.
|
4.350
|
4.553
|
Inner Carniola | ||
45.
|
4.206
|
4.503
|
Styria | ||
46.
|
4.131
|
3.928
|
Inner Carniola | ||
47.
|
3.892
|
3.477
|
Lower Carniola | ||
48.
|
3.811
|
3.865
|
Upper Carniola | ||
49.
|
3.787
|
4.192
|
Slovene Littoral | ||
50.
|
3.704
|
3.604
|
Lower Carniola | ||
51.
|
3.622
|
3.760
|
Slovene Littoral | ||
52.
|
3.743
|
3.588
|
Upper Carniola | ||
53.
|
3.449
|
3.006
|
Styria | ||
54.
|
3.244
|
3.460
|
Styria | ||
55.
|
3.278
|
3.456
|
Styria | ||
56.
|
3.236
|
3.273
|
Lower Carniola | ||
57.
|
3.228
|
3.534
|
Slovene Littoral | ||
58.
|
3.159
|
3.159
|
Styria | ||
59.
|
3.127
|
3.254
|
Carinthia | ||
60.
|
3.087
|
3.289
|
Carinthia | ||
61.
|
3.055
|
2.935
|
Styria | ||
62.
|
2.971
|
2.880
|
Styria | ||
63.
|
2.879
|
3.075
|
Upper Carniola | ||
64.
|
2.827
|
3.129
|
Prekmurje | ||
65.
|
1.986
|
2.174
|
Styria | ||
66.
|
1.926
|
2.168
|
Lower Carniola | ||
67.
|
1.539
|
1.631
|
Slovene Littoral | ||
68.
|
1.139
|
1.000
|
Lower Carniola | ||
69.
|
688
|
695
|
Lower Carniola | ||
- ^ "Population by large and five-year age groups and sex, settlements, Slovenia, annually (in Slovenian)". Retrieved 21 February 2018.
Categories
Slovenia • Culture • Economy • Education • Environment • Geography • History • Law • Military • People • Politics • Religion • Science and technology • Society • Sport • Tourism • Transport
Associated Wikimedia
The following Wikimedia Foundation sister projects provide more on this subject:
-
 Commons
Free media repository -
 Wikibooks
Free textbooks and manuals -
 Wikidata
Free knowledge base -
 Wikinews
Free-content news -
 Wikiquote
Collection of quotations -
 Wikisource
Free-content library -
 Wikispecies
Directory of species -
 Wikiversity
Free learning tools -
 Wikivoyage
Free travel guide -
 Wiktionary
Dictionary and thesaurus


